Check every pivot's sectors before you drive the circuit.
A weekly report compares each pivot's index and thermal pattern with where its sprinklers should be putting water. Sectors running dry or over-watered get flagged, so the crew goes to the pivots that need a truck.
- GSD
- Medium / 3–10 m
- Cadence
- Weekly
- Platform
- Medium-res satellite
- Spectral
- Multispectral (+ Thermal)
The circuit drive
Every season you drive the circuit and look. A clogged nozzle or a leaking boot shows up as a pale wedge in the crop, if you're on the right road on the right day. The pivots near the highway get seen, and so do the ones that have a history. Others run short for weeks until a grower calls. Or you send a truck for a pivot that turns out to be fine, and the truck could have gone somewhere else.
The same circuit, planned two ways
01Deciding which pivots to visit
Driving the circuit
The route, the pivots with a history and whoever phoned. Some never get looked at.
With the weekly sector report
A list of the pivots with a flagged sector this week, for the whole district, so the truck goes where the pattern is.
02Spotting a dry sector
Driving the circuit
A pale wedge or a stripe of stressed crop, seen from the road, if the light and the angle cooperate.
With the weekly sector report
Each pivot is read sector by sector against its own geometry, so a wedge that lags its neighbours gets flagged whether or not you drive past.
03Telling dry from over-watered
Driving the circuit
You look at the crop and the ground and make a call.
With the weekly sector report
The thermal read shows sectors that run warmer or cooler than the rest of the circle, so over-watering gets its own flag beside the dry ones.
Still yours
Deciding whether a wet patch is a leak, a low spot or a soil change.
04Keeping track week to week
Driving the circuit
Notes in the truck, a work order, and memory.
With the weekly sector report
A change log lists what is new since last week's pass, so a sector that has been dry for three passes reads differently from one that showed up today.
05Finding the cause
Driving the circuit
You get out and look at the sprinklers.
With the weekly sector report
The report points you to a sector and a pattern. You still make the visit.
Still yours
Walking the span, replacing the nozzle, fixing the boot and running the catch can test.
What lands each week
One set of files per pivot per week through the irrigation season, in formats a district office already opens.
Sector report
PDF and CSVOne page per pivot, one line per sector, each flagged against the pivot's own geometry. It is the sheet you hand the crew before they load the truck, and the CSV loads into the work-order list.
Comparison rows: 01 Deciding which pivots to visit,02 Spotting a dry sector
Thermal overlay
GeoJSONThe sectors that read warmer or cooler than the rest of the pivot, drawn on the circle. It opens in the GIS layer the district already keeps, on top of your pivots and parcels.
Comparison rows: 03 Telling dry from over-watered
Weekly change log
Change logWhat is new since last week's pass: sectors that started to flag, sectors that cleared, and pivots that sat under cloud. It tells you what to look at first.
Comparison rows: 04 Keeping track week to week
Through the irrigation season
You send the pivots once. The report comes back every week the water is running.
Before the season opens
01Send your pivots
Pivot locations and geometry: center point, radius and, where you have it, the spans and the end gun. A GIS layer works, so does a list.
02Set the season
Tell us when the district opens and closes the water. That sets the weeks we run.
Every week of the season
03Weekly pass, compared
A medium-res multispectral and thermal pass over your pivots, with each sector's pattern compared against what the pivot's geometry says it should show.
04Report goes out
That week's sector report, thermal overlay and change log.
After the water shuts off
05The run stops
The weekly run ends with the season you set. If the board shortens or extends it, tell us.
What the circuit drive still does better
Read these before you cut a trip from the route.
It flags a sector, not a part
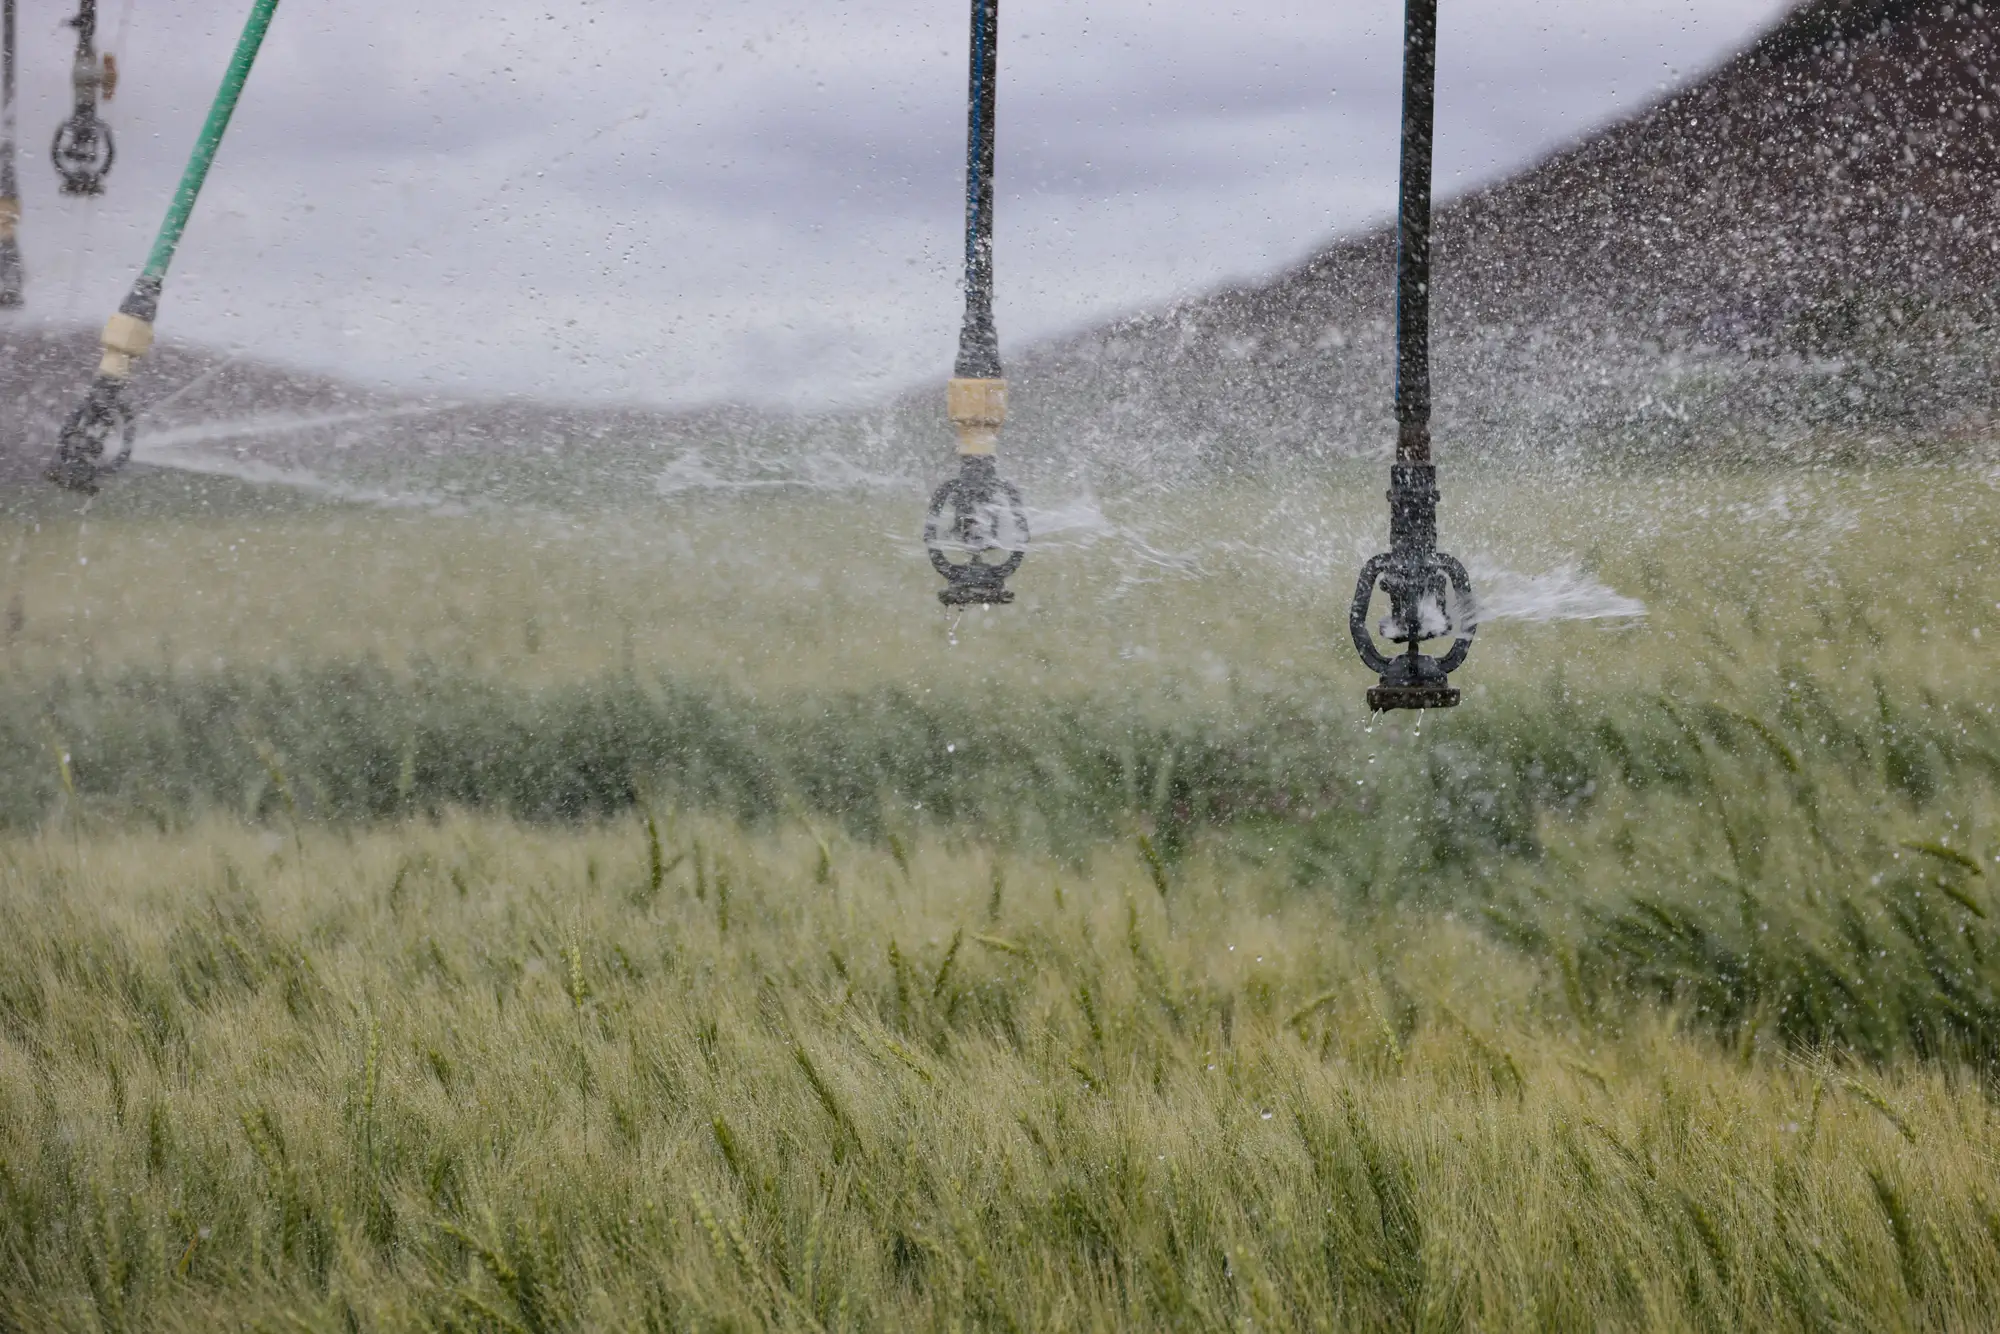
The report tells you a sector is dry or warm and what the pattern looks like. It doesn't say whether the cause is a nozzle, a valve, a boot or pressure. That takes a person at the pivot.
Cloud skips a week
Optical and thermal both need a clear view. A cloudy week for a pivot is skipped, and the change log says so. A truck on the road doesn't have that problem.
A pixel is bigger than a nozzle
At 3–10 m a pixel covers far more ground than one sprinkler. We read a sector, never a single nozzle. Very short spans are harder to separate into sectors.
Thermal is coarser than the multispectral
The thermal read is the blunter of the two. It shows a sector running warm or cool; it can't tell you which sprinkler is to blame.
Weekly is the target
Weekly is the plan, not a promise about a delivery hour. A failure the day after a pass shows up on the next one. A grower's phone call is faster.
Switch if
- You are a district field engineer or operations lead who covers pivots across a whole district and can't look at all of them each week.
- You want a shortlist of pivots and sectors to send the crew to, not another dashboard.
Stick with the circuit drive if
- You need to know which nozzle, valve or boot failed. Only a site check tells you.
- You need a catch can test or a formal uniformity evaluation. This isn't one.
- You need a same-day alarm when a pivot stops. The report is weekly.
- You run one or two pivots and already walk them.
Before you cut a trip
Does it replace the circuit drive?
It replaces driving to find out which pivots have a problem. You still go to fix them.
How do we check it against what we see?
Take the first weeks' flags and visit some of the flagged pivots and a few unflagged ones. Send back any sector that looks wrong and we'll go through that week's imagery with you.
Will it name the broken part?
No. It flags the sector and the pattern, dry or over-watered. A site check finds the cause.
What happens when it's cloudy?
That pivot is skipped for the week and the change log notes the gap. The next clear pass picks it up.
Is 3–10 m fine enough for our pivots?
It is fine enough to read sectors, not single nozzles. Very short spans are harder to separate, and we'll say so when we scope the run.
Is there a water-savings guarantee?
No. The report finds patterns. What you save depends on what gets fixed.
Will it plug into our GIS or work-order system?
There is no direct integration. The overlay is GeoJSON for your GIS and the sector report has a CSV that loads into anything that takes CSV.
Who owns the reports, and what about the imagery?
Your pivot locations stay yours. What you can do with the reports, and the licence on the imagery behind them, gets written into the project agreement before the first week runs.
How is it priced?
It depends on how many pivots and how many weeks, so we quote after we've seen the pivot list. There's no price list on this page.
Send us the pivot list before the water turns on.
Send a GIS layer or a list of pivot locations, plus when the district opens the season. We'll scope the weekly run from there.